
Automated system for collecting and visualizing analytics for the Wildberries marketplace.
A program that automatically retrieves all reports from the Wildberries seller's dashboard on a schedule, stores them in a database, and outputs ready-made summary tables in Google Sheets — without manual downloading and copying.
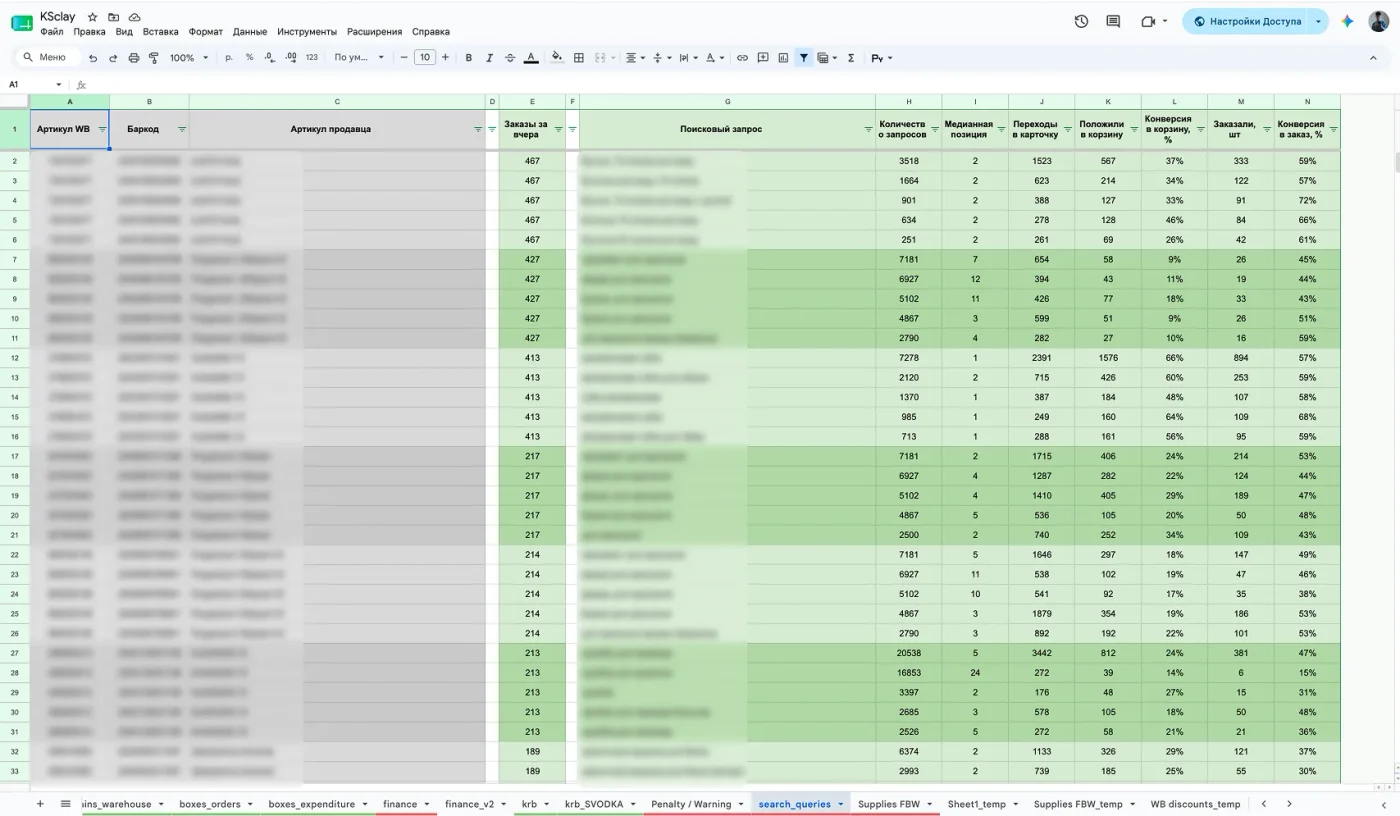
Slide 1 of 7
DESCRIPTION
ETL pipeline in Python that fully automates the collection of business data for a marketplace seller. The system independently gathers around twenty types of reports (orders and the order feed, inventory, fines and deductions, discounts, commissions, CTR, product characteristics, advertising expenses, FBW deliveries, search queries, paid storage, warehouse tariffs, price indexes, problematic and blocked listings, the weekly financial report), normalizes them, and maintains an up-to-date set of management sheets in Google Sheets. The codebase is divided into four layers — authorization and profile preparation, raw data collection, loading into PostgreSQL, and exporting to sheets — plus an isolated layer for access credentials and configuration.
Orchestration
The root process runs in an infinite loop with a configurable interval and sequentially launches three stages as separate processes on each iteration: collection → database → export, followed by preventive cleanup. Within each stage, the dispatcher spawns child scripts and executes them in parallel, controlling each with an individual timeout: a hanging script is forcibly terminated, and associated hanging browser processes are cleaned up. Due to process isolation, the failure of one report does not affect neighboring ones or the pipeline as a whole. All processes are launched through a common runner that provides end-to-end error interception (extracted into a separate job).
Data collection channels
Data collection occurs through two channels depending on what Wildberries provides. Where there is an official API (advertising, FBW deliveries) — REST requests with JWT authorization, pagination, throttling under request limits, and client-side aggregation are used. Reports not available in the API are obtained through browser automation using Selenium: the script opens a real account, initiates server-side generation of an Excel report for the required period, and downloads the finished file. The scripts are written to handle the unstable and constantly changing layout of the personal account: a cascade of backup selectors prioritizing stable attributes, clicks with JavaScript rollbacks, waiting for asynchronously generated reports through queue status polling, and bypassing interface traps like banners that divert from the page. The downloading of large files is monitored by the appearance of results with filtering of incomplete downloads.
Chrome profile pool
The Chrome profile pool is a key solution in the collection layer. Authorization (login by phone and SMS via Selenium) is performed once, after which the master profile is cloned into twenty independent profiles, and each downloader works on its own. This allows reports to be collected in parallel and the session to be preserved between cycles. Profiles are serviced by separate utilities: checking authorization status, safely clearing the cache, and removing lock files before each run so the profile does not "get stuck". A separate maintenance task is truncating the profile's bloated service files: Chrome accumulates them from cycle to cycle, and without cleanup the profile eventually stops starting at all.
PostgreSQL data layer
The data layer is PostgreSQL, with a unified schema accessed via psycopg2 with connection resilience settings. DDL is idempotent and lives in the code: tables are created if they do not exist, and new report fields are picked up by automatic migration (ALTER TABLE ... ADD COLUMN IF NOT EXISTS) without manual intervention. Writing is done in batches; the product catalog is updated through upsert. Data is not overwritten but accumulated as snapshots with timestamps — the database retains history, and exports read the latest slice. The product catalog is a core entity: other tables are built relative to it, ensuring that each product has a row even with zero metrics.
Excel report parsing
Parsing of the original Excel reports is resilient to "dirty" Wildberries files: archives are read from memory without unpacking, header rows are determined heuristically, columns are matched by normalized names with a fallback on positional indexes, and numbers are carefully converted to types (commas, non-breaking spaces, percentages, empty values). A particularly complex module is the weekly financial report: deduction amounts are collected from different columns depending on the type, and the types themselves are unknown in advance and come in long strings. Since the column name in PostgreSQL is length-restricted, each type is assigned a short key, and the correspondence "key → full name" is stored in a separate table; account-level accruals are distributed proportionally across products.
Export to Google Sheets
Export to Google Sheets is performed through a service account based on atomic publishing: each script writes to a temporary sheet, and only after the successful completion of all uploads are the main sheets atomically replaced — the user never sees a partially filled table. Formatting (number formats, percentages, visual group separators) is set through batch requests to the API. Some sheets are assembled not by mirroring a single report but by joining multiple tables with grouping and sorting; for specific sheets, an expanded Google Apps Script web application is called for final formatting.
New reports and calculated sheets
The set of management sheets has grown thanks to reports that were not in the original version: price indexes, problematic and blocked listings, the order feed, paid storage and warehouse tariffs, the WB catalogue of items and categories. Some of the new sheets are not a mirror of a report but a calculation on top of several tables.
The logistics and storage cost sheet calculates what a product costs before it is sold. It joins paid storage (the only report that shows what is stored in boxes and what on a mono-pallet), warehouse tariffs, inventory, CTR and the product catalogue, and adds an expense that is not and cannot be in the WB tariffs — our own delivery to the warehouse. The price of shipping a pallet to each warehouse is manual data from the director, pallet capacity is kept in a separate sheet which, if the source file is lost, falls back to a snapshot stored in the code. The pallet price is averaged across warehouses by weight, based on the actual inventory of the SKU: shipping to Koledino for 781 ₽ and to Vladivostok for 18,750 ₽ is very different money, and a simple average over three dozen warehouses would hang the Vladivostok price on a product that never went there. Warehouses closed after fires are excluded from the calculation: WB keeps showing them in the storage report, and without a filter part of the weight would land on goods that are not physically there.
The second calculated sheet is the Wildberries discount ladder. The discount the platform puts on top of our price does not change smoothly but in steps tied to the product price, and at a step boundary the price for the customer drops as ours rises: by raising the price from 2,000 to 2,001 ₽ we get one rouble more while the customer pays 170 less. WB does not publish the thresholds, so the sheet takes a grid of round numbers and calculates the discount at each step empirically — from our own products over the last few days, broken down by "item × delivery scheme". An extra threshold in the grid is harmless: if nothing changes at it, the neighbouring steps coincide, and that is visible right in the row. The sheet used to be item-by-item, by SKU; the summary answers the same question for the whole catalogue at once.
Yesterday's orders no longer depend on a single report: they are assembled from two different reports of the seller dashboard, and the figure that is more complete goes into the sheet. The same rule picks the source for orders broken down by shipping warehouse — WB reports disagree with each other, and previously this silently understated the numbers.
Reliability work
A separate line of work was reliability — following what the error log showed. The export scripts start almost simultaneously and hit a single Google service account, which answers a burst with a quota refusal (the limit is 60 write requests per minute): on one day there were six such bursts, producing 116 errors. Now all exports go through a shared client with retries attached to the single method through which all API calls pass inside the library — there was no need to wrap every call in every script.
Report downloading no longer mixes up files: the downloads folder is shared, reports are downloaded in parallel, and previously the script grabbed the first file that appeared, whoever it belonged to. Now each report waits for a file matching its own mask — the same one the loader later uses to find it for the database. Errors are written to the log in full, without truncation, otherwise the stack was lost exactly where it was needed. Failures are grouped by meaning: if at least one of the four inventory reports failed to download, none of them go into the database — an incomplete inventory snapshot is worse than none at all.
Cross-cutting solutions
Cross-cutting solutions: a unified text protocol for diagnostics (success / deletion / error with type, message, and stack), which the logging subsystem relies on; all secrets and external accesses are extracted from business logic and overridden through environment variables; time is consistently set to the Moscow timezone; dependency versions are fixed.
TOOLS USED
- Python 3
- Selenium
- WebDriver
- Chrome/ChromeDriver
- Chrome DevTools Protocol
- pandas
- openpyxl
- PostgreSQL
- psycopg2
- gspread (Google Sheets API)
- Google service account
- Google Apps Script
- requests
- REST API Wildberries (JWT authorization)
- pytz
- subprocess (multiprocess orchestration)
- Git
RESULT
- Built an end-to-end ETL pipeline "collection → PostgreSQL → Google Sheets" that runs on a schedule without human involvement.
- Implemented an orchestrator of independent processes with parallel execution, individual timeouts and cleanup of hanging browser processes — the failure of one report does not break the pipeline.
- Automated the collection of around twenty types of reports through two channels: the official Wildberries REST API and Selenium browser automation for data unavailable via the API.
- Created a pool of twenty pre-authorized Chrome profiles with a one-time SMS login and a profile assigned to each downloader — for parallel collection and session preservation.
- Developed Selenium scripts resilient to layout changes: a cascade of selectors, fallback to a JavaScript click, waiting for asynchronously generated reports, bypassing interface traps, and download control.
- Designed a PostgreSQL schema with idempotent table creation, automatic structure migration, batch inserts and upsert of the catalogue; data is stored as snapshots over time.
- Implemented a robust Excel/ZIP parser on pandas with heuristic header detection and safe type casting.
- Solved a non-trivial financial report task: a dynamic set of deduction types with generated column keys working around PostgreSQL limits, a lookup table, and proportional distribution of account-level charges.
- Introduced an atomic publishing mechanism for Google Sheets via temporary sheets, programmatic formatting and post-processing through Google Apps Script.
- Implemented the assembly of summary sheets by joining several tables with grouping and sorting.
- Added reports that were not in the first version: price indexes, problematic and blocked listings, the order feed, paid storage, warehouse tariffs, and the WB catalogue of items and categories.
- Built a logistics and storage cost sheet: a join of six sources, our own delivery to the warehouse with the pallet price weighted by actual inventory and closed warehouses excluded.
- Built a summary of the Wildberries discount steps: unpublished thresholds are reconstructed from actual catalogue data, broken down by "item × scheme".
- Yesterday's orders are cross-checked against two independent reports and the more complete figure goes into the sheet — the discrepancy between WB reports no longer understates the numbers.
- Eliminated a mass source of export failures: a shared Google Sheets client with retries removed the quota refusals that produced over a hundred errors a day.
- Parallel downloading no longer mixes up files — each report picks up its own by mask; errors are logged in full, and an incomplete inventory snapshot does not reach the database at all.
- All secrets and access credentials are moved into a separate layer overridable through environment variables.
AI-ASSISTANT
Ask a question about this project